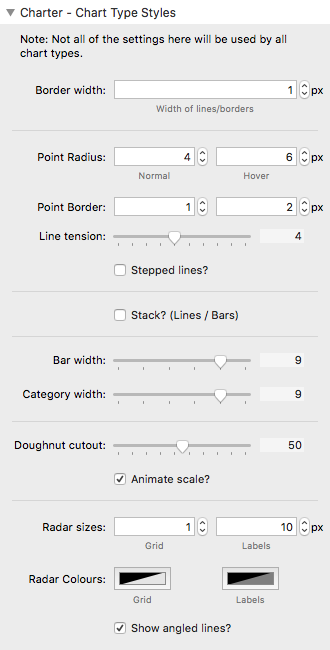
Charter - Chart Type Styles
These control provide some options that are specific to the different chart types. As such, not all controls are relevant for all chart types. The dividing lines largely group options that are applicable to the different chart types.
Border width
This setting effects any border / line / stroke within the chart.
Point Radius
[Line and Radar Charts only] Points are the markers that indicate each data point on the chart. The radius determines how big these should appear (in normal and hover modes).
Point Border
[Line and Radar Charts only] Some point types have a border and a fill area. This setting allows you to state the border size (in normal and hover modes).
Line tension
[Line and Radar Charts only] The line tension controls how curved (or straight) the lines between data points appear. Selecting a value of 0 will make all lines completely straight.
For a radar chart you will most likely always want to set this value to 0.
Stepped line?
[Line Charts only] This setting will force the line to traverse the chart horizontally between each data point, creating a 'stepped' appearance.
Stack? (Line / Bars)
Instead of showing each dataset's value at each point individually, you can opt to show a cumulative value by 'stacking' the values. This can be done for Line or Bar charts.
Doughnut cutout
You can specify how large you want the hole in the middle of the doughnut to be (as a percentage).
Note: If using more than 1 dataset in the chart then please ensure that you leave enough of the doughnut to accommodate the included datasets otherwise the chart will not be drawn.
Animate scale?
You can opt to turn off the scale animation (i.e. animating the chart from small to big). The regular circular reveal animation will remain.
Bar width / Category width
[Bar Charts only] These settings allow you to determine how wide the bars can be within their containing space. The bar width is how much of the category container the bars should take up (1 = 100% of the width). The category width determines how much of the chart container each category can use (again 1 = the full available width).
Radar sizes
[Radar Charts only] Here you can specify the width of the gridlines used to build the radar chart and also the font size used for the labels at each point.
Radar colours
[Radar Charts only] Here you can specify what colours the gridlines and label font should be.
Show angled lines?
[Radar Charts only] Radar charts consist of concentric shapes. You can opt to hide the angled lines that are used that go from the central point of the radar to each label.